IELTS Pie Chart Task 1 - Samples And Tips for Success
Last updated: Dec 30, 2025The IELTS writing task is often considered the most challenging part of the entire exam for several reasons. One of the major factor contributing to this challenge is the pie chart task 1, which is a common question in the IELTS writing section. Therefore, carefully analyzing and describing the pie chart will help you ace this task of the exam. Thus, this blog aims to provide guidance on how to ace the pie chart task 1 of the test to reduce your worries. Let's start with having an overview of this in the upcoming section of the blog.

Table of Contents
Understanding IELTS Pie Chart Task 1
In the IELTS writing task of the academic module, you are expected to describe visual data or information. The visual might be a pie chart, bar graph, diagram or diagrams. This blog aims at pie charts, a circle chart that is divided into pie slices, which are the sectors. These charts usually illustrate the percentages of something. Hence, the pie chart represents various segments with several categories. The size of each segment reflects its proportion as a whole. Thus, your task is to summarise the information presented in the chart and make the relevant comparison wherever needed.
Moreover, make sure to organise your answers properly and that the flow is not broken. The steps to a good answer are given in the next section.

Pie Chart Task 1 Samples & Answers (2026)
In this section, we’ve compiled a selection of Pie Chart Task 1 Samples & Answers to help you understand how to effectively structure your response. Explore the samples below for a better understanding.
Pie Chart Sample 1

Pie Chart Sample 1 Answer
The pie chart shows the percentage of greenhouse gases emitted by various activities, such as electricity, transportation, different industries, and commercial and residential activities. Moreover, agriculture makes a minute contribution to the emission of these gases.
The general trend of the pie chart shows the maximum greenhouse gases released during electricity generation.
Agriculture tops the list of factors that contribute the least to greenhouse gas emissions. It only contributes 9% of the total gas emissions. On the other hand, commercial and residential activities like using fridges and air conditioners contribute 12%. Moreover, various industrial activities emit 21% of these harmful gases.
In contrast, the main reason that releases these gases are several modes of transport, which exude 21% of the greenhouse gases. The maximum is secreted by electricity generation, which contributes 30% to nature.
Pie Chart Sample 2

Pie Chart Sample 2 Answer
The given pie charts illustrate the percentage of various sources of energy which were produced between 1995 and 2005.
Overall, it can be observed that most of the energy production has seen an exponential increase, with petrol as an exception. Moreover, it can be noted that coal saw the highest trend in the decade, becoming the main energy source used by people.
The two sources of energyoccupys more than half of the total pie charts in the period. About coal, it increased slightly from 29.80% to 30.93% between 1995 and 2005. Meanwhile, gas production rose gradually over time, reaching nearly 30% in the second year.
Taking a look at the alternate energy productions, nuclear and others increased nearly 5% from 64% to 10.1% and 4.9% to 9.1%, respectively. Likewise, in comparison with the others, petrol was the only energy source that saw a decrease.
Pie Chart Sample 3

Pie Chart Sample 3 Answer
The three pie charts illustrate the amount of money a particular UK school spent annually for the years 1981, 1991, and 2001.
As per the pie chart, the salaries of the teachers had the highest percentage for both years, while insurance accounted for the smallest percentage of money spent by the UK school in all of the three selected years.
A school spent 40% of the total spending amount on teachers’ salaries in 198,1 and it rose to 50% of the total amount in 1991. In 2001, the percentage slightly declined, ed which was 45%. The spending on other workers’ salaries dropped gradually from 1981 to 2001. In the beginning, it was 28% in 1981, decreased to 22% in 1991 and in 2001, it dropped to 15% eventually.
The money spent on furniture, equipment, and resources such as books was similar in 1981, which was 15% of the total amount. In 1991, a lot of money was spent on resources rather than furniture and equipment, 20% and 5% respectively, but this reversed in the year 2001. 23% of the money was spent on buying furniture and equipment, while 9% of the amount was spent on resources like books. The amount spent on insurance gradually increased from the year 1981 to 2001. In 1981, a small proportion of money was allocated for insurance. It was 2%, rose to 3% in 1991 and 8% in 2001.
Pie Chart Sample 4
Pie Chart Sample 4 Answer
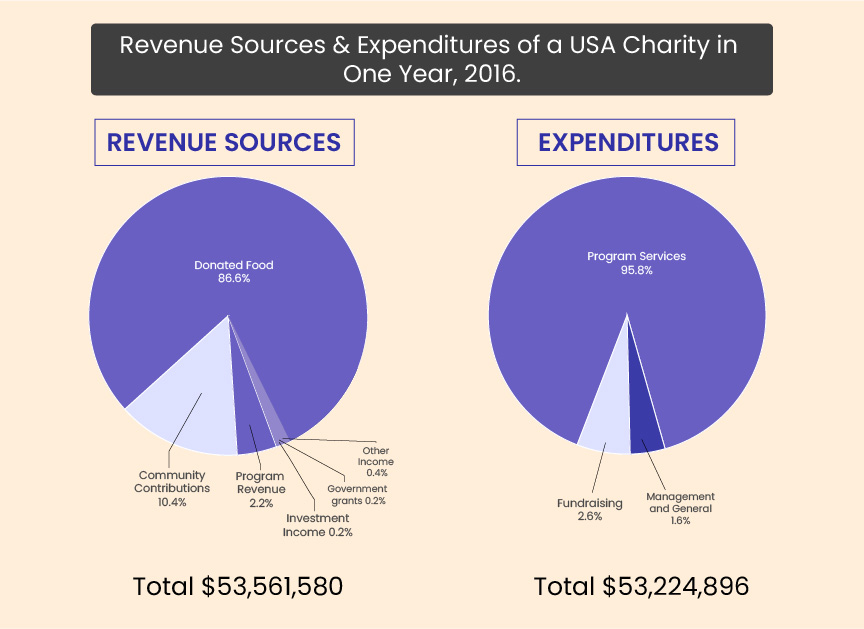
This pie chart for IELTS shows the amount of revenue and spending in 2016 for a children’s charity in the USA. Thus, it can be observed that donated food is considered the majority of income, while the program services are regarded as the largest expenditure. Total revenue sources just surpassed the outgoings.
In detail, the donated food provided most of the income for the charity, at 86%. Similarly, about expenses, one category, program services, accounted for nearly all of the outgoings, at 95.8%
Other categories were much smaller. Community contributions, which were the second largest income-generating source, brought in 10.4% of the overall income, and this was followed by the program revenue, at 2.2%. Investment income, government grants, and other income were very small sources of income, totalling only 0.8% combined.
There were two other expenditure items, fundraising and management and general, which accounted for 2.6% and 1.6% respectively. The total amount of income was $53,561,580, which was sufficient to cover the expenses of $53,224,896.
Pie Chart Sample 5

Pie Chart Sample 5 Answer
The above two pie charts compare the percentage of online sales around the various retail sectors in Canada in two different years, 2005 and 2010.
Overall, the online sales of electronic items and home furnishing fell; however, the craze for food and video games increased during the five years.
Beginning in 2005, the majority of online sales for the electronics and appliances sector were at 35%, and this percentage had dropped to 30% by 2010. During the five years, the number of people deciding to buy food and beverages online increased, and the deal went from just 22% to 32%, which makes the retail sector the largest proportion of the online market.
In 2005, the home furnishing industry boasted an impressive 25% of the total online sales in Canada. In addition, by 2010, this figure had fallen to 15%. Interestingly, the online sales of video games generally overtook the sales of home furnishing, despite video games still representing only 23% of the market.
Steps to Write an IELTS Pie Chart Task
In this section, there are five easy steps you can follow to write the answers to get the desired band score. Before moving to the steps, let us know about an ideal answer to the IELTS pie chart task 1, which must contain four paragraphs, which are as follows:
- Paragraph 1 should be the introduction of the given diagram.
- The next paragraph must have an overview of the pictorial representation.
- The third paragraph must contain the first main feature, while the last or fourth paragraph should have the second main feature.
Now comes the steps to write a good answer.
Step 1: Analyse the question
Although the format of every question type in the IELTS writing task of the academic exam is the same, the candidate must understand the question properly. Every question contains the diagram brief and the instructions. The diagram can be a chart, graph, or table.
Step 2: Identify the main features
Always remember that the pie chart IELTS task 1 is meant to determine your language skills, not your mathematical ability. If you are confused about what to write. Ask the following question to yourself.
- What are the measurement units?
- Is there any time period?
- What can you interpret from the title?
- What is the most obvious trend?
- Are there any significant similarities?
Step 3: Write an Introduction
The first sentence must be the paraphrased version of the question, so you achieve the task. On the other hand, the second sentence must have three things: The main feature, its description, and comparison (if applicable).
 Take Writing Mock Test Now!
Step 4: Write an Overview
In the second paragraph, you should report the identified main features which give only the general information. The details will be further mentioned in the flow of the essay.
Step 5: Write the Detailed Paragraphs
Till now, you have known the first two paragraphs of the writing task 1 pie chart task. The last two paragraphs will include the details of the main identified features. In paragraph 3, you should give evidence to support your first key feature. Don’t forget to make comparisons where relevant.
So, to complete the pie chart IELTS task 1, you need to write the last paragraph, which will have the second key feature concluding your part 1 of the IELTS writing task.
Factors Influencing Your Band Scores
Every section is marked on a few criteria. The presence of each factor is crucial as they directly impact your band score. These are as follows:
- Task Achievement - It simply means that the response covers all the task needs properly. Moreover, key features are appropriately selected, clearly presented, highlighted and illustrated.
- Coherence and Cohesion - The presence of this factor means that the essay is in the flow. Can be read and easily understood.
- Lexical Resources - The vocabulary is wide, and the synonyms are used in the right way. They don’t look absurd or incorrect.
- Grammar Range and Accuracy - The sentences are grammatically correct and error-free. Also, the punctuations are used wherever required.
These are the four factors that directly impact your IELTS band score. Each of them contributes equally. Always remember these factors and include things in the answer as per the task requirement. In the next section, let us know some tips to get better scores inthe writing task 1 pie chart task.
Tips to Improvise Pie Chart Section
After knowing everything about the IELTS pie chart task 1 from the steps of writing a good answer to sample answers, here are a few expert tips.
Understand the Requirement
It is crucial to understand the given requirement in task one of the writing section. Analyse the question, and start thinking of the points to include.
Structure Your Response/ Draft Your Answer
Drafting the answer before writing it down in the answer sheet becomes an important step. You can note down the key features to include in the answer. Also, you can bifurcate the keywords and phrases paragraph-wise to meet the requirement and complete the task in the time you allotted for yourself.
Practice Regularly
There are many complexities you may face while writing your answer for this task. It is vital to know the IELTS syllabus for the writing section to avoid any surprises. You can sign up for our FREE IELTS MOCK TEST to practice everything before attempting the official IELTS exam.
Manage Time
The writing task of the IELTS Academic lasts for 60 minutes. So, the test taker has to manage the time accordingly so they don’t miss out on the second task. Also, a candidate should spend only 20 minutes on task one, including the time to proofread,d so they have enough time to attempt the second task. Moreover,n o wing of the IELTS exam pattern would help the candidate to segregate time carefully.
Seek Expert Advice
The appearing candidate can sign up for online IELTS coaching to strengthen their preparation for the language proficiency test and ace it on the first attempt. The experts will make you familiar with many ttthingsuch as IELTS exam eligibility, pattern, and syllabus. It will help you to be familiar with the real IELTS exam and the key factors to keep in mind.
These were the expert tips that will help you ace the test in the first attempt. In conclusion, you got to know about the IELTS writing section, the sample answers, along with factors affecting band score and the steps of an ideal answer to get the desired band score.
0 comments

Practice Makes a Man Perfect!Take FREE ielts Mock Tests
Start FREE Mock Test


Get Unlimited Access with
IELTS Prep Boost
Mock Tests
Practice Questions
Study Material
Recorded Classes
What is your Target IELTS Band?


Get familiar with the Real IELTS Exam for Free!
Start Free Mock Test